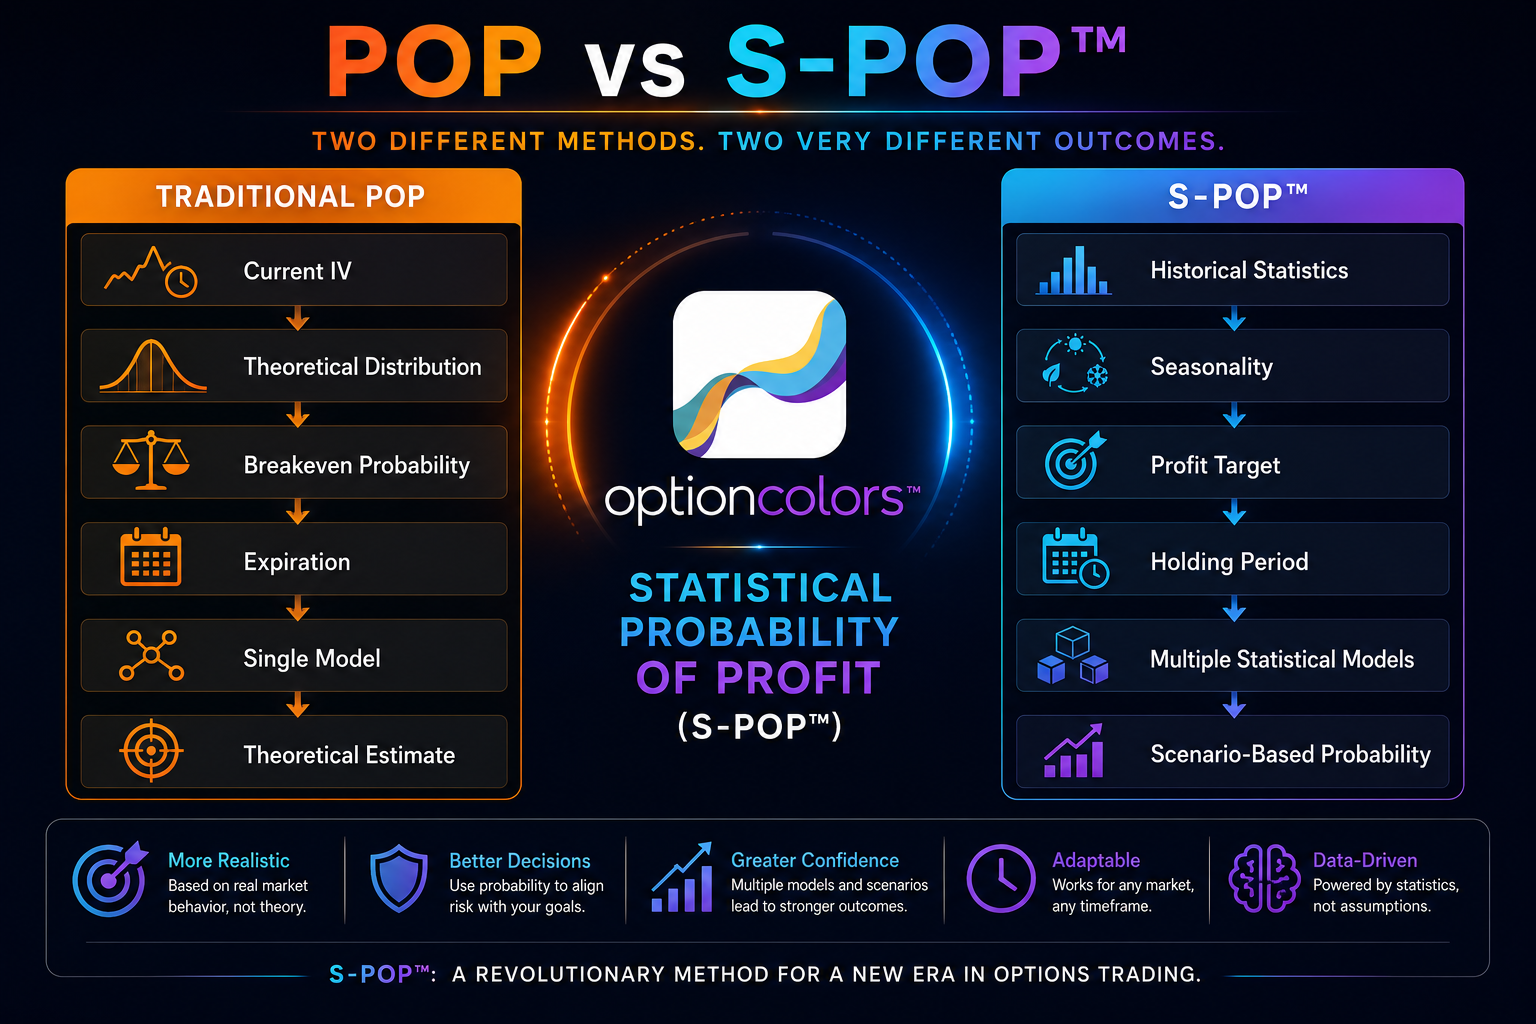
Probability of profit—commonly called POP—has become a familiar feature in options trading software. It is generally used to estimate the likelihood that a position will finish within a theoretical profit zone based on the current implied volatility of the underlying asset.
The method has remained popular because it is easy to display and understand. A platform can shade a range on a risk graph, assign a percentage to that range and give the trader an immediate probability estimate. The limitation is that the estimate can appear more precise than the assumptions behind it.
Traditional POP does not directly measure how the underlying has historically behaved under comparable market conditions. It also may not reflect the trader’s intended holding period, profit target or practical risk tolerance.
What Conventional POP Attempts to Measure
Conventional POP usually estimates whether the underlying price may finish above, below or between one or more breakeven points at a selected date. The calculation frequently begins with current implied volatility and a theoretical distribution of possible future prices.
Many platforms display familiar probability ranges such as approximately 68% for one standard deviation and approximately 95% for two standard deviations. These ranges can provide context, but they are model-based estimates rather than observations of what the market will actually do.
Three Important Limitations of Traditional POP
1. Price movement may not be perfectly symmetrical
Simplified probability models often begin with a distribution that treats upward and downward movement as symmetrical around the current price. Real markets can exhibit drift, skew, recurring seasonality, event effects and changes in behavior across different time periods.
An underlying may rise and fall with different frequencies or magnitudes depending on the market environment. A theoretical 50/50 directional assumption therefore may not describe the selected historical period very well.
2. Implied volatility can change materially
A conventional POP estimate often relies on current implied volatility or a user-entered future volatility assumption. Yet implied volatility can rise, fall or change differently across strikes and expirations during the life of the trade.
Even when the underlying remains inside a projected price range, the position may perform very differently because volatility, time decay, skew and Greek exposure changed.
3. The entire theoretical profit zone may not be practically usable
A broad profit zone does not automatically mean that every outcome inside that zone is acceptable. A trader may be unwilling or unable to hold through substantial drawdown, margin pressure, liquidity problems or adverse path risk.
A trade can therefore display a high theoretical POP while still offering an unattractive risk-to-reward relationship.
Probability should be evaluated alongside profit target, holding period, drawdown, volatility behavior and the complete risk structure of the position.
What Is S-POP™?
S-POP™ stands for Statistical Probability of Profit. It is a patent-pending OptionColors method designed to evaluate options-trade probability through selected historical statistics rather than relying only on a theoretical distribution derived from current implied volatility.
S-POP™ allows a trader to apply statistical observations to a current options position and evaluate the likelihood of reaching a defined profit objective within a defined period.
The user can build statistical scenarios from factors such as:
- Historical price movements
- Seasonal periods
- Selected volatility environments
- Different holding periods
- Specific profit targets
- Alternative historical samples and filters
Traditional POP vs. S-POP™
| Capability | Traditional POP | S-POP™ |
|---|---|---|
| Primary foundation | Theoretical price distribution | Selected historical statistics |
| Typical volatility input | Current or assumed implied volatility | Historical or user-selected volatility conditions |
| Directional behavior | Often modeled symmetrically | Can reflect observed historical behavior |
| Seasonality | Not typically incorporated | Can be incorporated |
| Historical price moves | Indirect theoretical estimate | Direct statistical input |
| Profit objective | Often based on breakeven at expiration | Can evaluate a specific target and time |
| Scenario flexibility | Usually limited | Multiple customizable statistical models |
| Best use | Quick theoretical range estimate | Scenario-specific statistical comparison |
A More Practical Probability Question
Traditional POP often asks whether a position may finish above breakeven at expiration. Many options traders, however, do not plan to hold every trade until expiration and are not merely trying to earn a nominal profit.
A trader may want to earn a defined amount within five trading days, close the trade before an earnings event or exit after reaching a specified percentage of maximum profit.
Based on the selected historical observations, how often would this position have reached my defined profit target within my intended holding period?
S-POP™ and Seasonality
Some underlyings exhibit recurring behavior during particular months, earnings cycles, market regimes or event windows. A broad all-period sample may conceal those differences.
S-POP™ can be configured around selected historical periods so the trader can compare the current trade with a more relevant statistical sample.
S-POP™ and Volatility Conditions
Volatility is dynamic. A probability estimate may look attractive under one volatility assumption and change substantially under another.
S-POP™ enables the user to compare statistical scenarios associated with different volatility conditions. This can help reveal whether a probability estimate remains relatively stable or depends on one narrow set of assumptions.
S-POP™ in Action
On a typical options risk graph, conventional POP may appear as a shaded theoretical price range superimposed over the expiration payoff. The user sees one-, two- or three-standard-deviation boundaries based largely on the selected volatility input.
S-POP™ adds a statistical layer. The platform can apply selected historical observations to the current position, evaluate whether a defined target would have been reached and report the proportion of observations that met the criteria.
The user can then change the historical sample, volatility condition, seasonality filter, profit target or holding period and compare the results.
Probability Must Be Considered With Risk
No probability percentage should be evaluated in isolation. A high estimated probability can still be associated with a large maximum loss, severe drawdown, poor liquidity or unfavorable tail risk.
OptionColors combines probability analysis with risk profiles, volatility tools, Greeks, higher-order Greeks, strategy comparison and backtesting so users can evaluate probability within the complete structure of the trade.
S-POP™ Does Not Predict the Future
Historical statistics do not guarantee future results. Outcomes can vary materially depending on the sample period, data quality, market regime, volatility conditions, execution assumptions and the selected profit objective.
S-POP™ should be treated as a decision-support and scenario-comparison tool. Its purpose is to help traders test assumptions and understand how probability changes when the statistical model changes.
A New Perspective on Options Probability
Traditional POP remains useful as a fast theoretical estimate, but it is not a complete measure of how a position may behave.
S-POP™ offers a more flexible statistical perspective. It allows traders to evaluate selected historical price behavior, seasonality, volatility environments, holding periods and actual profit objectives.
The result is a probability analysis built around the trader’s real question—not merely whether the position falls inside a theoretical range, but whether the selected statistical evidence supports the intended trade objective.