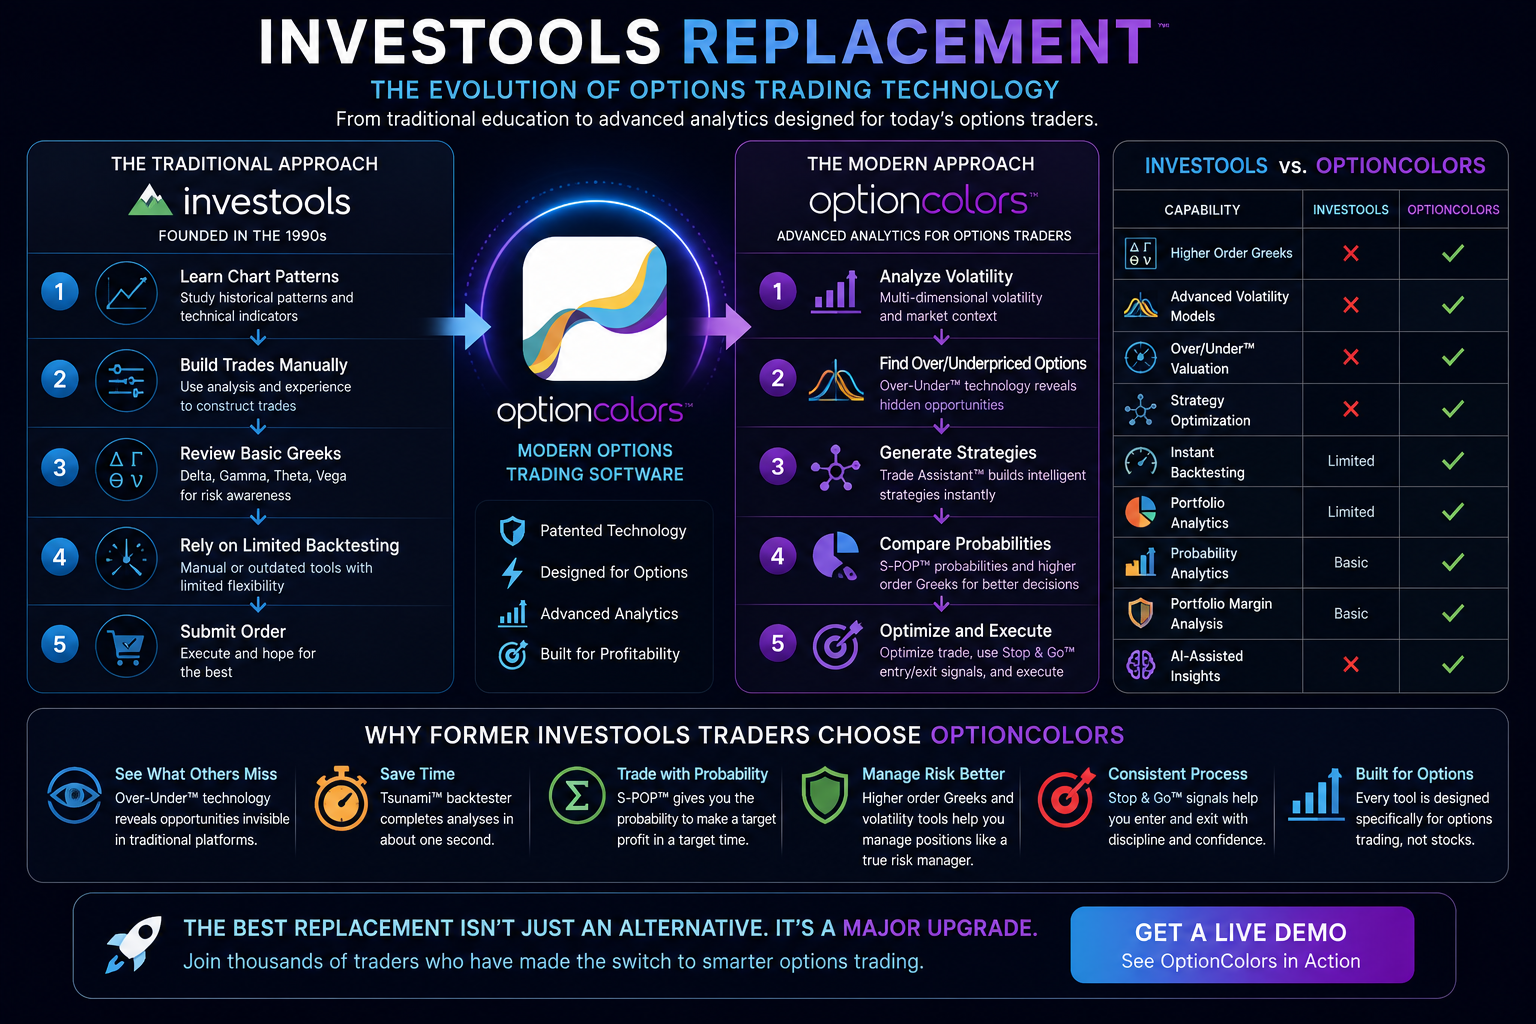
When TD Ameritrade discontinued Investools, many long-time users were left searching for a replacement. For traders who had built their education and workflow around the Investools toolbox, losing access could feel disruptive. But the options-software landscape has changed substantially, and today's traders can evaluate tools that were not available when Investools was originally developed.
Investools helped popularize options education, technical analysis and structured trading programs. Its courses, seminars and software introduced many traders to chart patterns, indicators and repeatable decision processes. That contribution remains important.
At the same time, modern options trading requires more than a visually appealing charting package. Options are affected by price, implied volatility, time decay, skew, term structure and multiple layers of Greek exposure. A useful Investools replacement should therefore be designed around the behavior of options themselves—not merely around stock-chart signals.
Investools Helped Educate a Generation of Traders
Investools became well known for combining education, live instruction and analytical software. Its premium programs could include seminars, boot camps, mentoring and access to multiple trading tools. For many clients, the appeal was not only the software but also the structured learning environment surrounding it.
The platform emphasized chart patterns, technical indicators and visual decision systems. Those methods were easy to communicate and helped new traders organize market information. However, a workflow created primarily around equity charts does not necessarily address the additional variables that determine an option's value and risk.
Chart Patterns Are Only One Piece of the Puzzle
Chart patterns remain popular because they provide a visual framework for interpreting price movement. Traders commonly study formations such as double tops, triple tops, triangles, flags and head-and-shoulders patterns.
Their usefulness can vary considerably depending on the market, timeframe, definition and testing method. A pattern that appears persuasive on a chart may produce inconsistent results when coded and tested across a larger sample.
OptionColors has tested commonly used chart-pattern concepts through systematic scripts. The results reinforced an important lesson: chart formations should not be treated as reliable directional predictions by themselves. Even a pattern that performs better than others may occur too infrequently to support an active trading workflow.
For options traders, the limitation is even greater. A correct directional forecast can still lead to a losing trade when implied volatility falls, time decay accelerates, the wrong expiration is selected or the position contains unfavorable Greek exposure.
Options Require More Than Price Action
An equity trader may focus primarily on direction and timing. An options trader must also consider the price of volatility, the passage of time, the shape of the volatility surface and how each leg of a position responds as the market changes.
A stock can move in the expected direction while an option position underperforms because the implied-volatility assumption was wrong. Likewise, a trader can be directionally incorrect and still produce a favorable result when the position was constructed with attractive relative value and appropriate risk characteristics.
A modern Investools replacement should help traders evaluate not only where the underlying may move, but also whether the options being bought and sold are attractively priced.
Investools vs. a Modern Options Platform
| Capability | Traditional Investools Workflow | OptionColors™ |
|---|---|---|
| Primary analytical focus | Charts and technical indicators | Volatility, value, risk and probabilities |
| Option valuation analysis | Limited | Over-Under™ relative-value analysis |
| Higher-order Greeks | Not central to the platform | Integrated charts and analytics |
| Strategy generation | Manual construction | Trade Assistant™ comparison workflow |
| Real-time position backtesting | Limited | Tsunami™ current-position testing |
| Statistical probability analysis | Basic or model dependent | S-POP™ statistical probability tools |
| Entry and exit workflow | Indicator-based signals | Stop & Go™ option-focused analysis |
| Portfolio-margin analytics | Limited option-specific risk modeling | Advanced Greeks and volatility tools |
Beyond the Three Green Arrows
One of the memorable Investools concepts was the use of three green arrows as a visual confirmation signal. The idea was easy to understand: when multiple indicators aligned, the trader received a clear directional cue.
Visual signals can make complex information easier to process, but the logic behind them matters. A stock-oriented signal does not automatically account for implied volatility, term structure, skew, theta exposure or the interaction among multiple option Greeks.
OptionColors developed Stop & Go™ as an option-focused decision tool. Its purpose is not to copy a discontinued stock signal, but to provide entry and exit context using logic designed for options positions.
Volatility Is Central to Options Trading
A 52-week implied-volatility rank can provide useful context, but it is only one measurement. Volatility changes across strikes, expirations and market regimes. Two options on the same stock can carry materially different relative value even when they share the same headline IV rank.
OptionColors was built around volatility analysis. The platform includes tools designed to examine relative value, skew, term structure, volatility relationships and the interaction between market movement and option pricing.
This approach helps move the trader beyond the question, “Is volatility high or low?” and toward more useful questions:
- Which options appear relatively overvalued?
- Which options appear relatively undervalued?
- How does volatility differ across strikes and expirations?
- Which strategy uses those relationships most effectively?
- How will the position's volatility exposure change as the market moves?
Over-Under™ Relative-Value Technology
OptionColors Over-Under™ technology is designed to help traders identify options that appear relatively overvalued or undervalued within the platform's analytical framework.
Traditional option chains display prices, implied volatility and Greeks, but they do not necessarily explain whether one contract is attractively priced relative to another. Over-Under™ adds a value-oriented perspective intended to help traders decide which options may be more appropriate to buy and which may be more appropriate to sell.
The objective is similar to a principle used throughout investing: seek attractive value when buying and avoid giving away value when selling.
Backtesting Should Save Time
Backtesting can help traders evaluate assumptions, compare positions and identify risks that may not be obvious from a payoff diagram.
Traditional backtesting often requires the user to create a historical trade, advance it through old data and repeat the process for additional dates. Automated systems can improve speed, but they still commonly test reconstructed historical trades.
OptionColors includes multiple backtesting approaches. Tsunami™ is designed to test the trader's current position against historical market movements, allowing the user to evaluate a present-day stock and options structure without recreating a different trade in the past.
Strategy Construction and Optimization
A modern options platform should do more than place four legs into an order ticket. It should help the trader compare structures and evaluate how each candidate fits the market outlook.
Trade Assistant™ is designed to generate and compare multiple strategies through a more structured workflow. Rather than building one spread at a time, traders can review alternatives, compare risk and probabilities, and select candidates for closer analysis.
This does not eliminate judgment. It reduces repetitive construction work so the trader can spend more time evaluating the quality of the idea.
Higher-Order Greeks and Portfolio Risk
Delta, gamma, theta and vega provide essential information, but complex positions can require a deeper understanding of how those exposures change.
Higher-order Greeks help describe relationships such as how vega changes when volatility changes, how delta responds to volatility and how time affects other risk measurements. These relationships can become especially important for multi-leg positions and portfolio-margin accounts.
Portfolio margin can provide significant flexibility, but it also makes accurate risk analysis more important. Traders using leverage should understand how positions may react to large market moves, volatility changes and nonlinear Greek exposure.
S-POP™ Statistical Probability Analysis
Conventional probability of profit generally estimates whether a position will finish above or below a breakeven point at expiration under a theoretical distribution.
OptionColors S-POP™ is designed to provide a different statistical perspective. It helps traders evaluate the probability of reaching a specified profit objective within a specified period, subject to the assumptions and data used by the model.
The purpose is not to guarantee an outcome. It is to help traders compare scenarios and make more informed decisions about risk, reward and time.
What to Look for in an Investools Replacement
Former Investools users may prefer a platform that preserves the clarity and visual appeal they became accustomed to while providing a more modern analytical foundation.
A strong replacement should help traders:
- Analyze implied volatility across strikes and expirations
- Identify relative value among option contracts
- Compare multiple strategies efficiently
- Evaluate statistical probabilities and potential drawdowns
- Understand advanced and higher-order Greek exposure
- Backtest positions without excessive manual work
- Review portfolio-level risk before committing capital
The Investools Replacement Is Here
Investools helped many traders begin their education, but options technology has continued to evolve. Traders no longer need to limit their workflow to chart patterns, basic volatility ranks and manual strategy construction.
OptionColors combines visual design with option-specific analytics intended to help traders study volatility, compare value, build strategies, test scenarios and manage risk.
For former Investools users, the transition does not have to mean recreating the same toolbox. It can be an opportunity to adopt a more advanced approach built specifically for options.