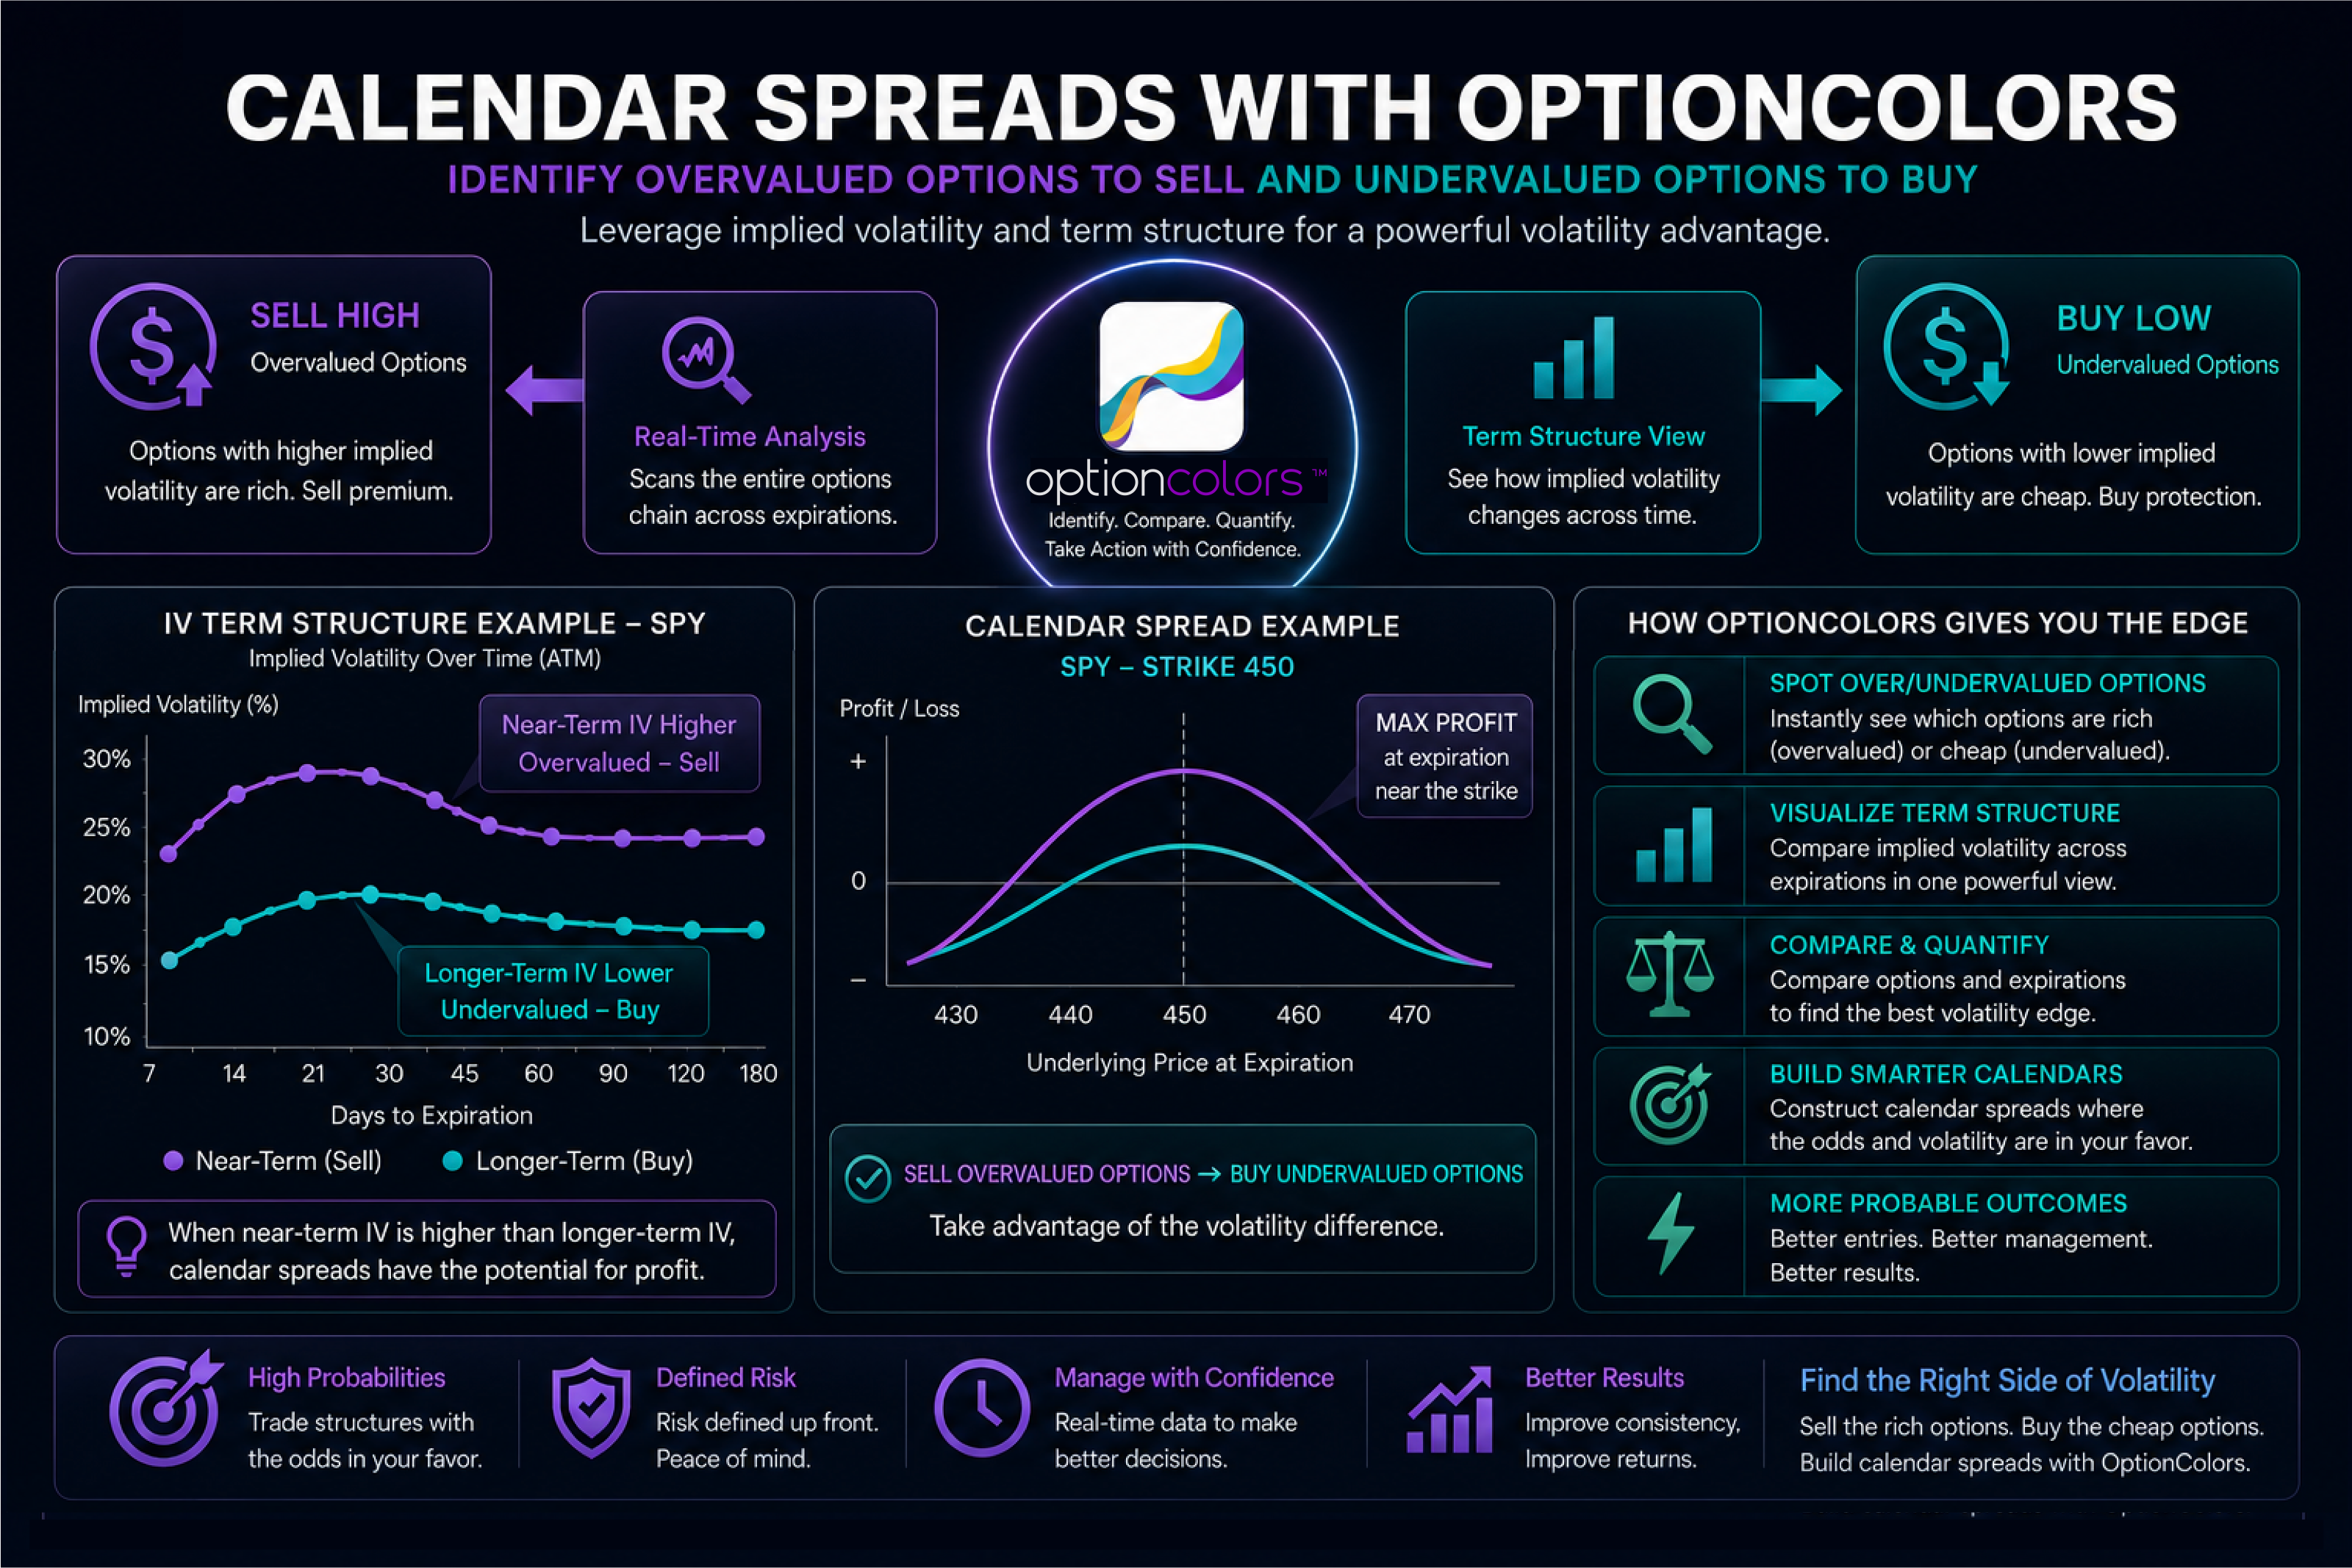
Calendar spreads are often introduced as straightforward time-decay strategies: sell a near-term option and buy a longer-term option at the same strike. That description is mechanically correct, but it overlooks one of the most important drivers of the trade—implied volatility.
Every calendar spread exchanges volatility exposure between two expirations. The trader is selling the implied volatility embedded in one option while buying the implied volatility embedded in another. If that relationship is unfavorable at entry, the trade may begin with a structural disadvantage that time decay alone may not overcome.
Calendar Spreads Are Relative-Value Trades
A calendar spread usually consists of a short option in one expiration and a long option at the same strike in a later expiration. Although the strike may be identical, the two options can carry very different implied volatility levels.
This difference is part of the market's volatility term structure—the relationship between implied volatility across expiration dates.
A trader entering a calendar spread is therefore making more than a directional or time-decay decision. The trader is also making a relative-value judgment about the volatility of the near-term option compared with the volatility of the longer-term option.
Understanding Horizontal Volatility Skew
Options traders often use the term volatility skew to describe differences in implied volatility among strikes. Calendar spreads introduce another dimension: differences in implied volatility across expiration dates.
This relationship is sometimes called horizontal skew or term skew. It answers a simple but important question: how expensive is the volatility being sold relative to the volatility being purchased?
Suppose the near-term option has an implied volatility of 24%, while the longer-term option has an implied volatility of 30%. The trader may be selling lower-priced volatility and buying higher-priced volatility.
That does not automatically make the trade unattractive. The later expiration naturally contains more time and may reflect different market expectations. However, the relationship must be understood before the trade is entered.
How an Unfavorable Skew Can Affect the Trade
A calendar spread may appear attractive on a conventional risk graph while still containing an unfavorable volatility relationship.
If the longer-dated option is comparatively expensive, the trader may pay more for volatility than the position is likely to recover through the decay of the short option. If the volatility relationship later normalizes, the long option can lose relative value even when the underlying asset remains near the selected strike.
In that situation, the trader may have correctly forecast direction and time decay but still experience a disappointing result because the volatility relationship moved against the position.
More favorable conditions
What traders may seek
- Near-term volatility that is relatively rich
- Longer-term volatility that is reasonably priced
- A strike aligned with the expected price path
- Sufficient liquidity in both expirations
Potential warning signs
What can weaken the trade
- Selling comparatively inexpensive volatility
- Buying unusually expensive deferred volatility
- Wide bid-ask spreads or poor execution
- A strike poorly aligned with the market outlook
Why Traders Often Miss the Volatility Relationship
Many options platforms present calendar spreads primarily through a payoff diagram, maximum-profit estimate, Greeks and expiration breakevens. These measurements are useful, but they may not clearly display the relative volatility being bought and sold.
As a result, traders may select a calendar spread because the risk graph looks appealing without seeing that the position contains a significant volatility disadvantage.
When the relevant term structure and skew information is difficult to locate—or not displayed at all—it becomes harder to distinguish between a well-priced calendar and one that merely has an attractive theoretical payoff.
Calendar Spreads and Event Volatility
The volatility relationship becomes especially important around known events such as earnings announcements, economic reports or regulatory decisions.
An expiration containing a major event may carry substantially higher implied volatility than the expirations immediately before or after it. A trader who ignores the event structure may unintentionally sell the wrong expiration or purchase volatility after it has already become unusually expensive.
In some cases, the event premium is precisely what the trader intends to capture. In others, it introduces a risk that is inconsistent with the original trading thesis.
The important point is that the event premium should be visible and intentionally selected—not discovered only after the trade behaves differently than expected.
Strike Selection Also Changes the Skew
A calendar spread is not defined solely by its expirations. The selected strike determines which part of each expiration's volatility surface is being traded.
At-the-money, out-of-the-money and in-the-money options can carry different implied volatility levels. Moving the calendar to another strike may therefore change both its directional profile and its relative volatility.
Two calendar spreads using the same expiration dates can represent materially different trades when placed at different strikes.
What to Evaluate Before Entering a Calendar
Before entering a calendar spread, a trader should be able to explain:
- Which expiration's volatility is being sold.
- Which expiration's volatility is being purchased.
- Whether the near-term volatility is rich or cheap relative to the deferred expiration.
- Whether a scheduled event is influencing either expiration.
- Why the selected strike is appropriate for the expected movement of the underlying asset.
- How the trade may respond if volatility rises, falls or changes unevenly between expirations.
- Whether execution costs materially reduce the trade's expected advantage.
This framework does not guarantee that a calendar spread will be profitable. It does, however, help ensure that the trader understands the volatility relationship being accepted at entry.
Seeing the Complete Volatility Structure
OptionColors is designed to make these relationships more visible. Rather than evaluating a calendar spread solely through a conventional risk graph, traders can examine implied volatility, strike skew, term structure, relative value and the position's changing risk characteristics.
The objective is not to label every calendar spread as favorable or unfavorable. It is to give traders enough information to understand what they are buying, what they are selling and how the relationship may influence the trade.
Better visibility can help traders avoid entering similar calendar structures under materially different volatility conditions and then wondering why the results were inconsistent.
A Better Framework for Calendar Spreads
Calendar spreads should not be reduced to the idea that the near-term option decays faster than the longer-term option. That is only one part of the position.
A more complete analysis considers the price of volatility in both expirations, the shape of the volatility surface, the selected strike, scheduled events, liquidity and the expected movement of the underlying asset.
When those elements are viewed together, a calendar spread becomes easier to understand as a relative-value volatility trade rather than simply a time-decay strategy.